Employee Well-being Insights Dashboard
Background
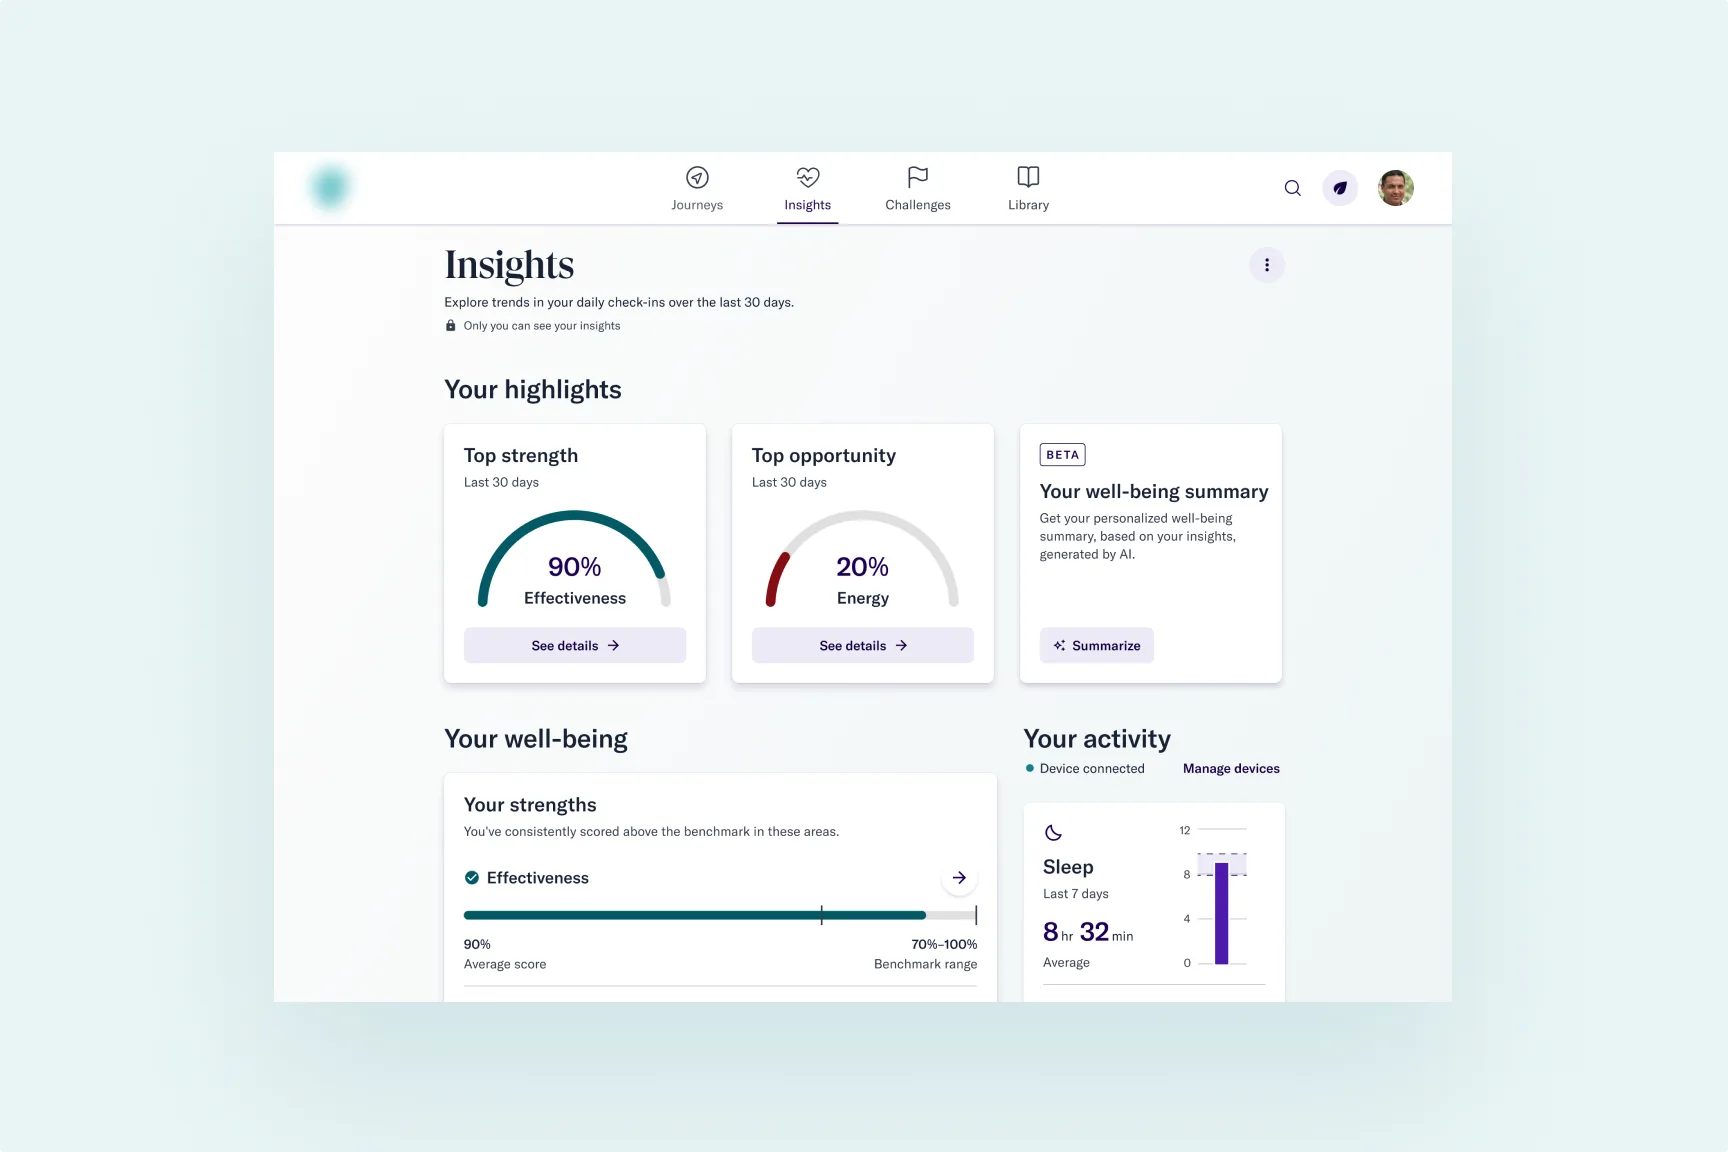
Previously, only company executives had access to company-level insights. To empower employees to measure their own well-being based on their in-app Daily Check-Ins, I designed the first-ever user-level insights dashboard at Thrive Global.
Team: 1 designer (me), 1 product manager, 1 tech lead, 3 engineers.
Impact
Increase in weekly Daily Check-In responders (24K to 55K)
Completion rate of out-of-box experience (OOBE)
Interaction rate among insights dashboard users
Rated the dashboard 4 or 5 out of 5 for effectively measuring their well-being
Feature highlights
Well-being details
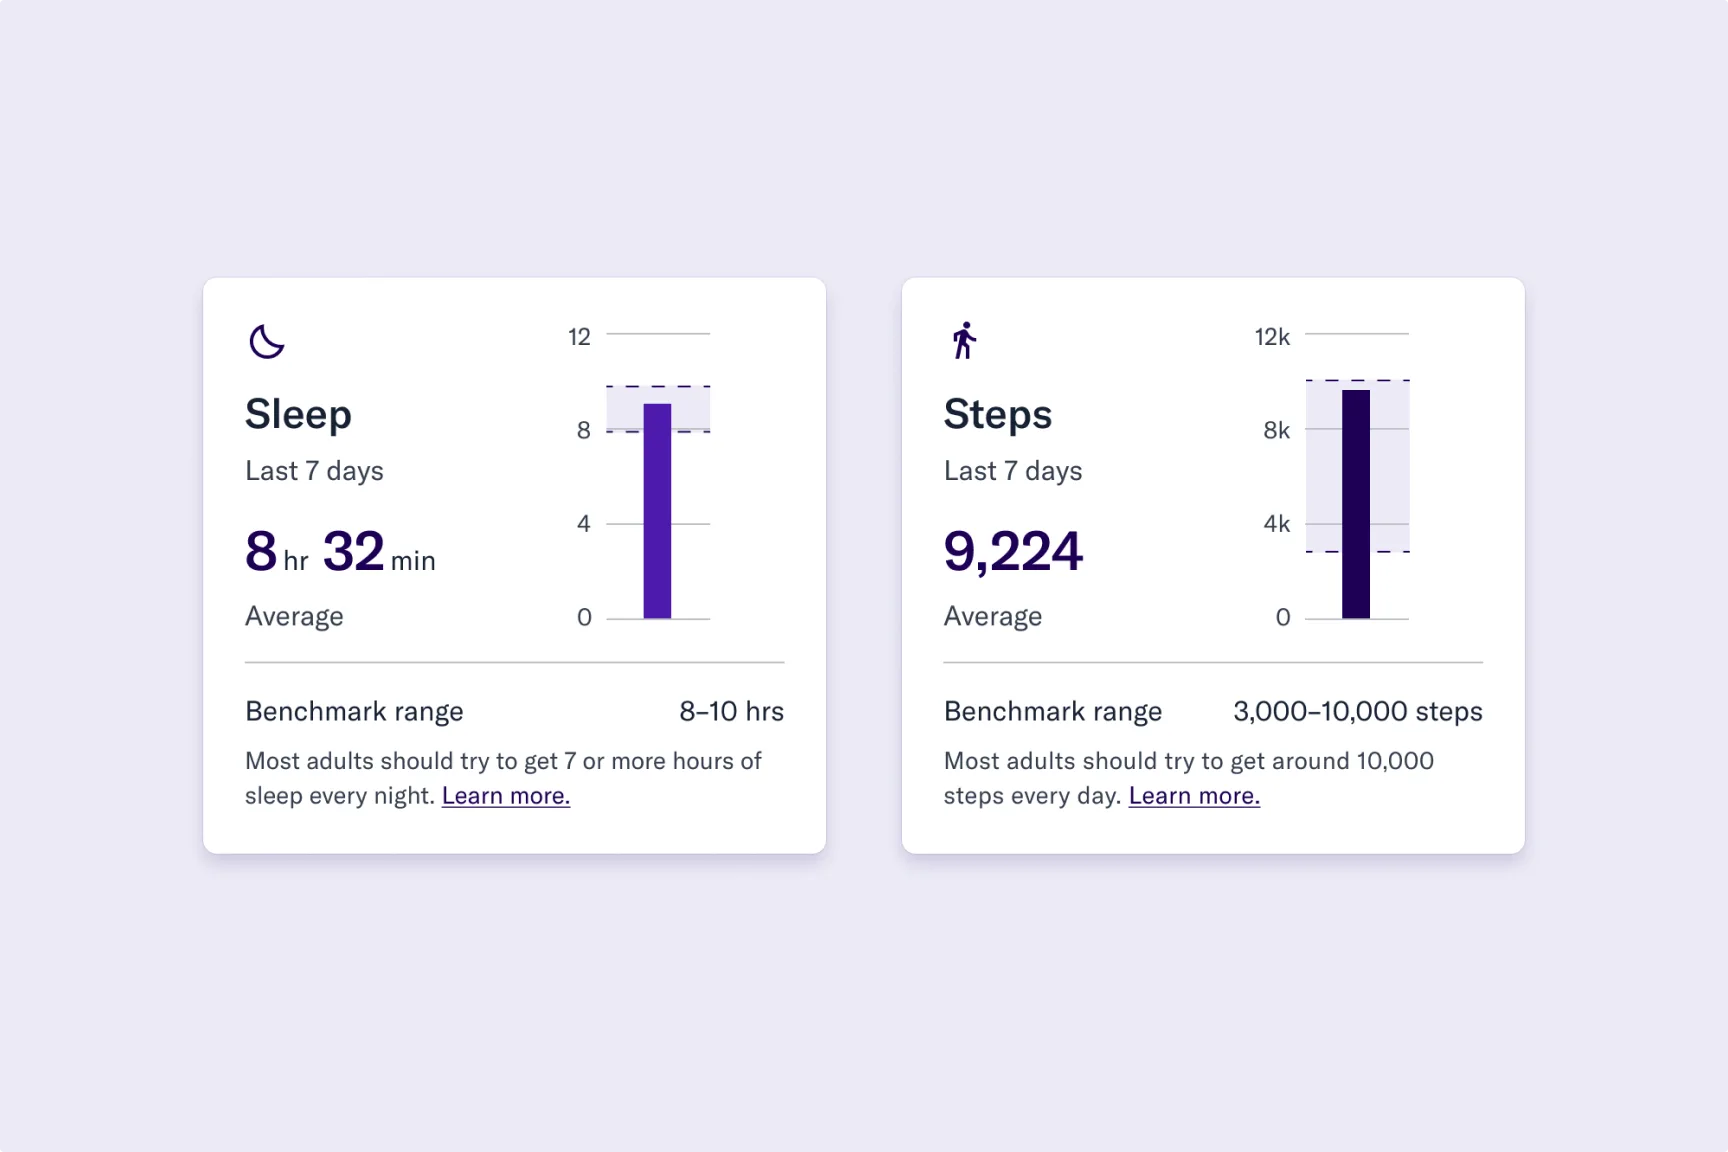
Dig into each dimension and see how your scores have changed over time.
Compare to your activity
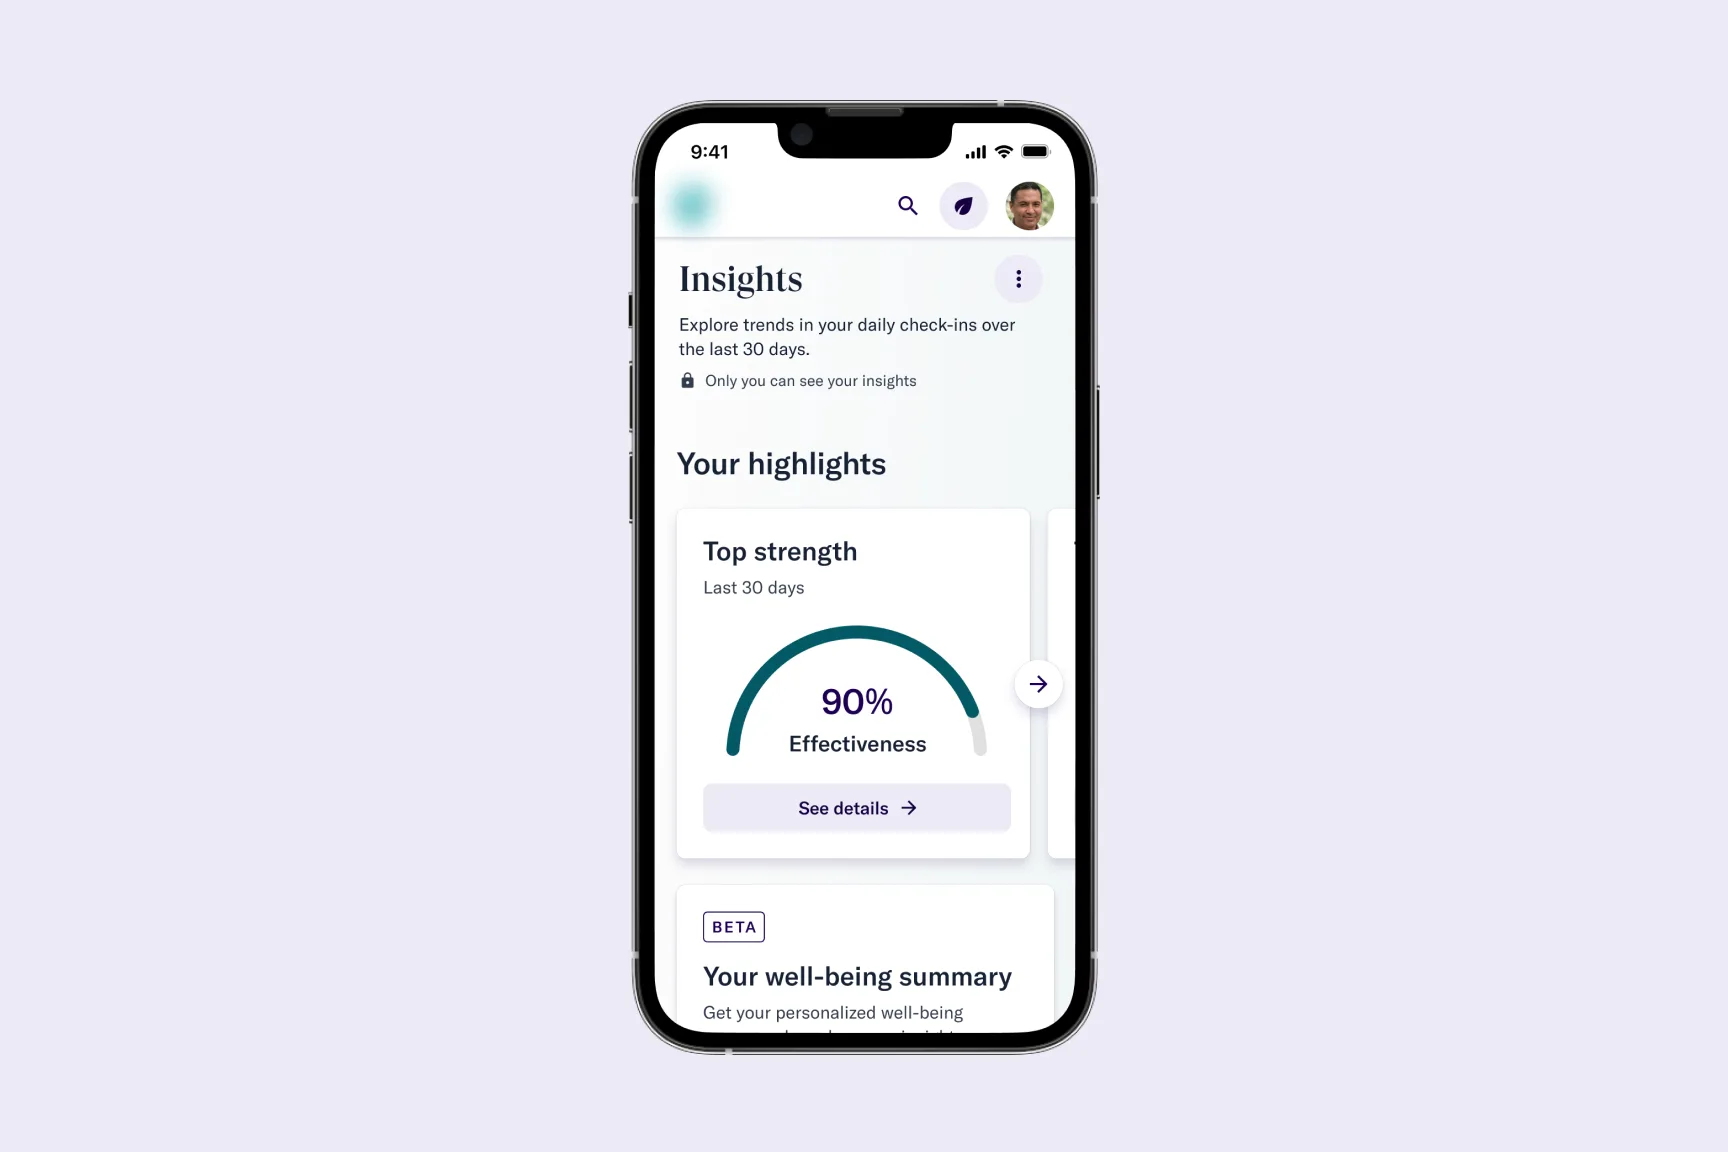
Compare your well-being scores to your activity data from connected health and wearable devices.
Personalized recommendations
Receive personalized content recommendations to help you along your well-being journey.
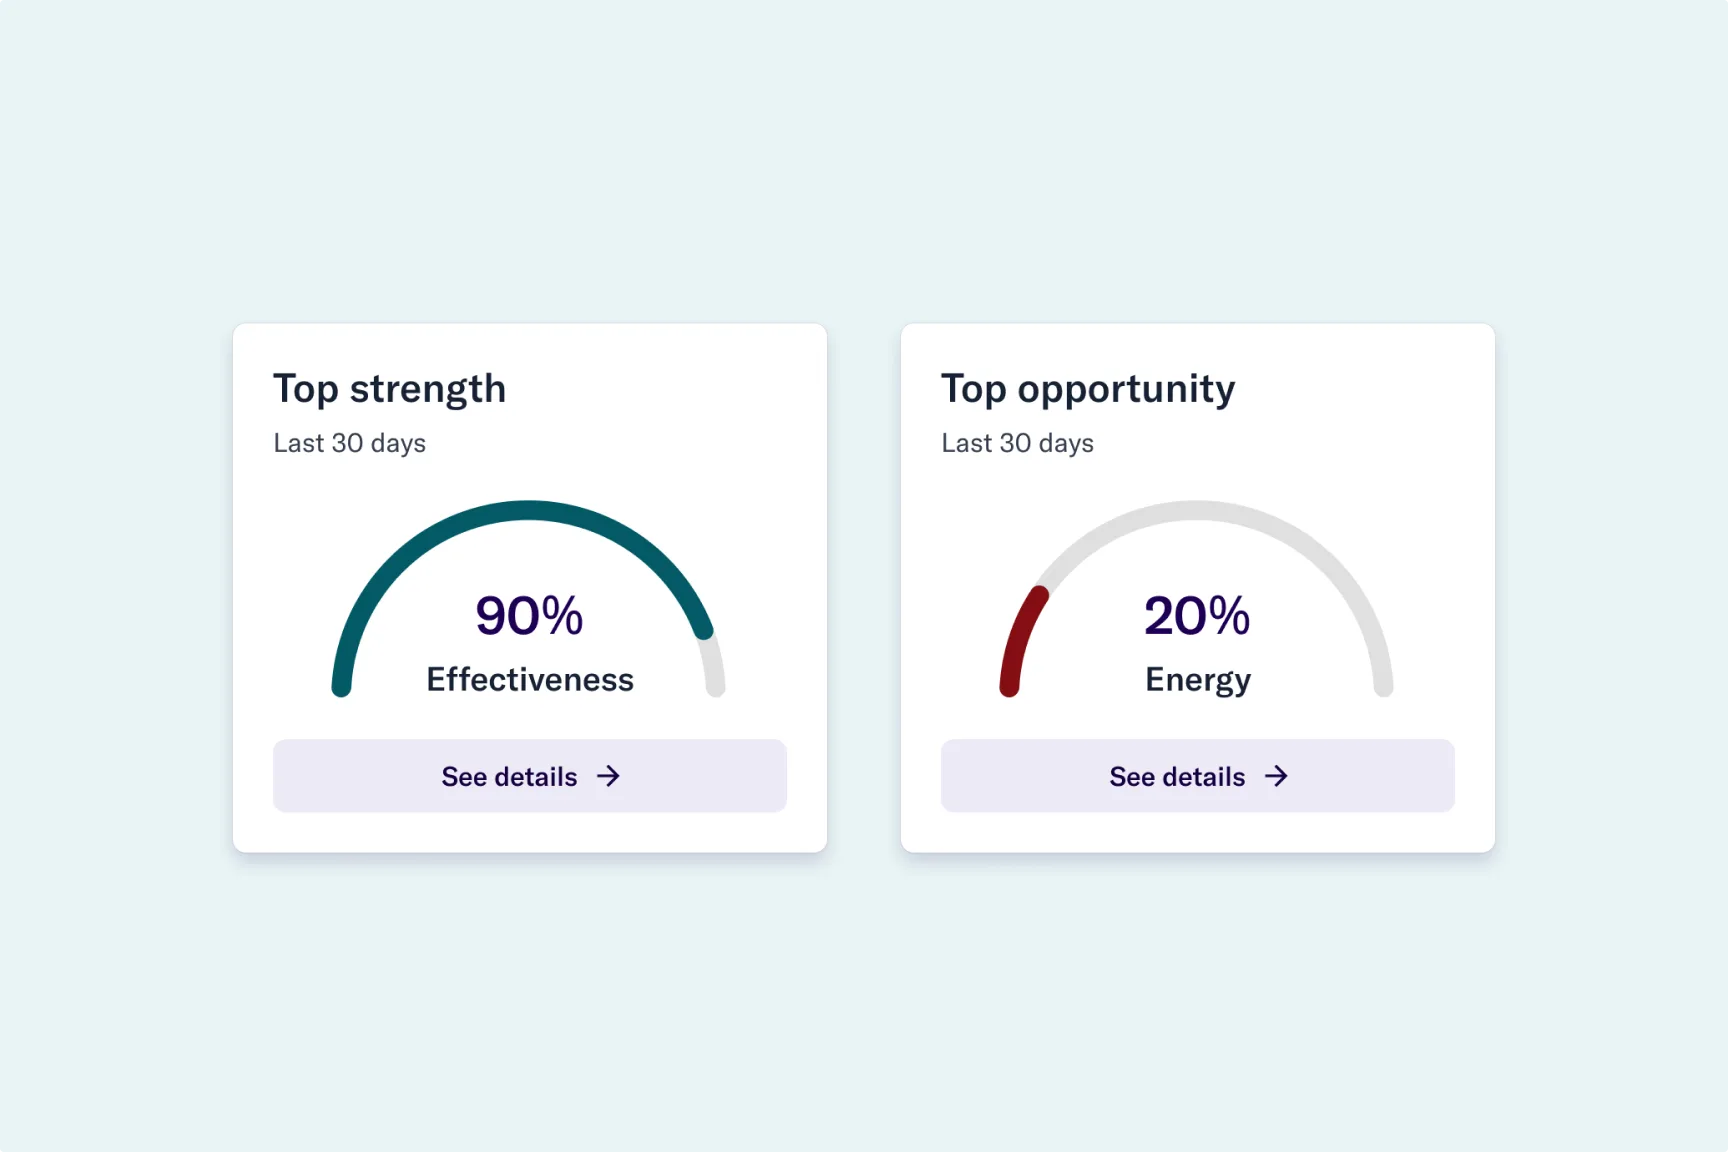
Top strength and top opportunity
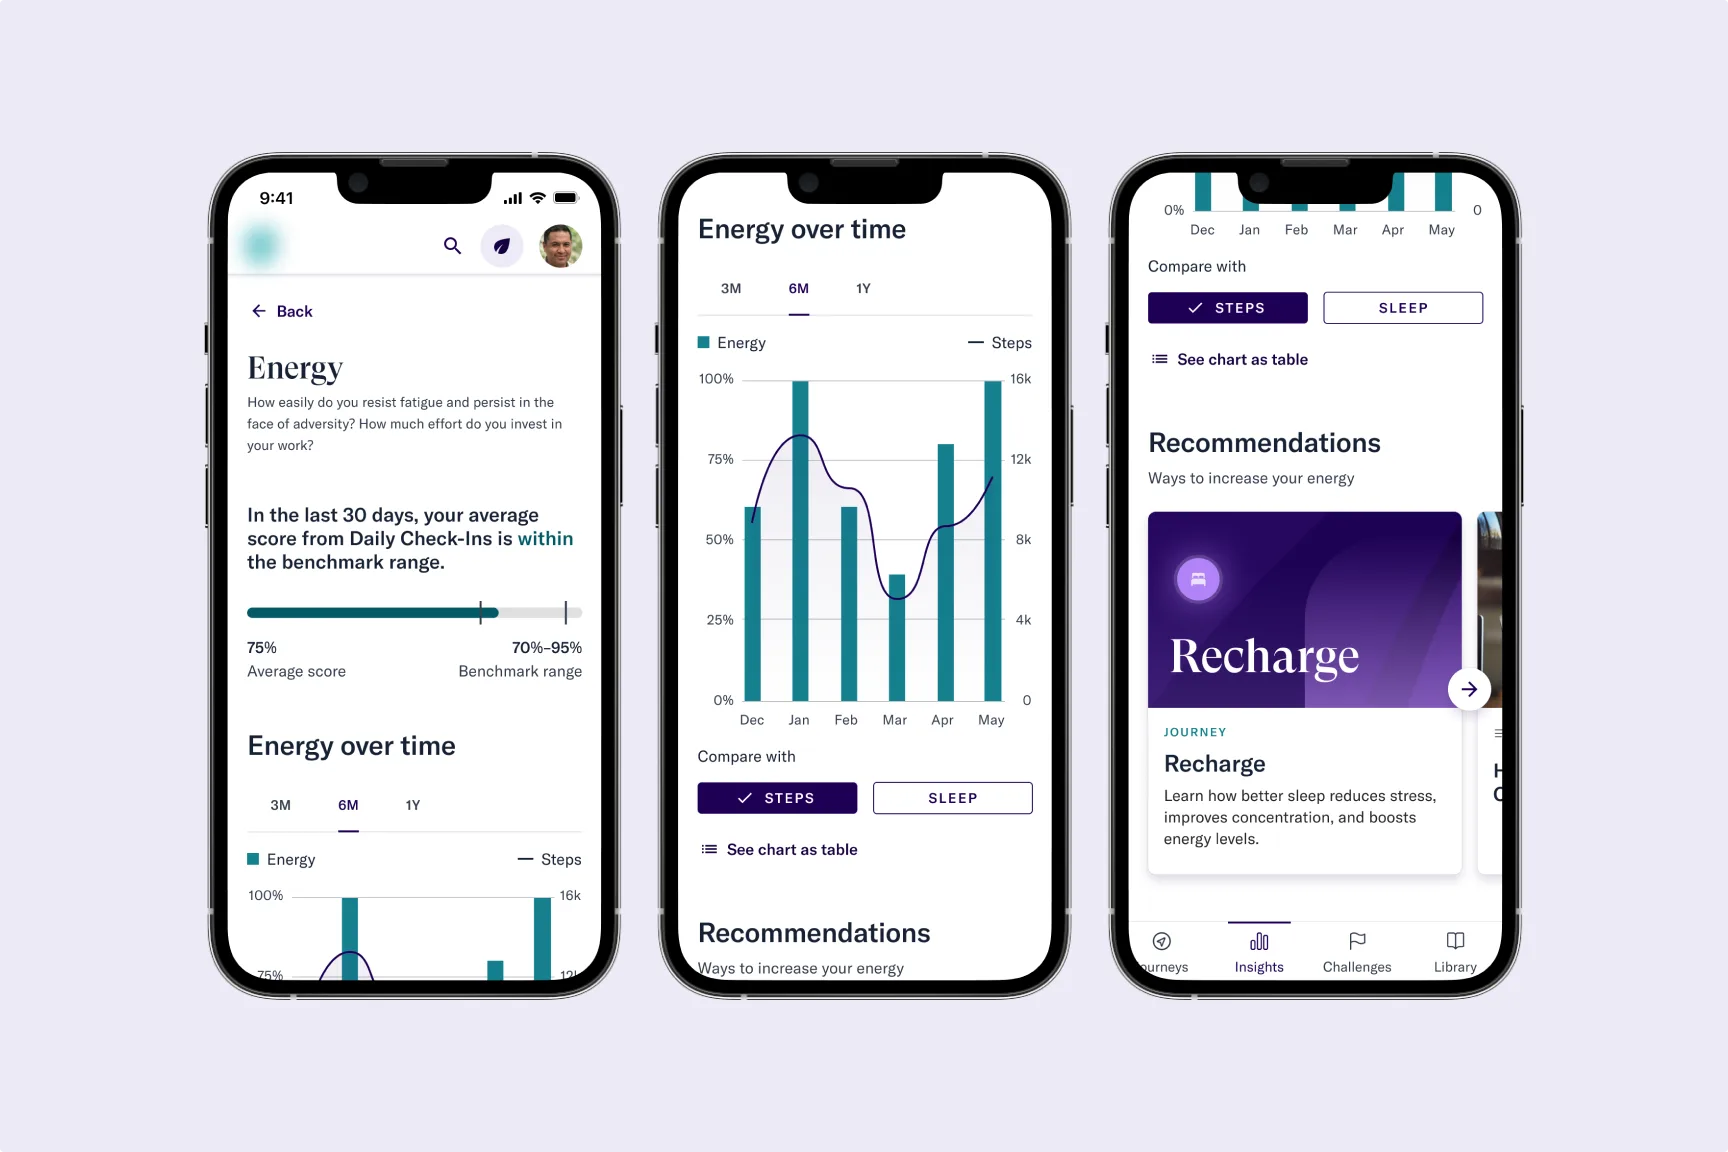
See your top strength and top opportunity at a glance.
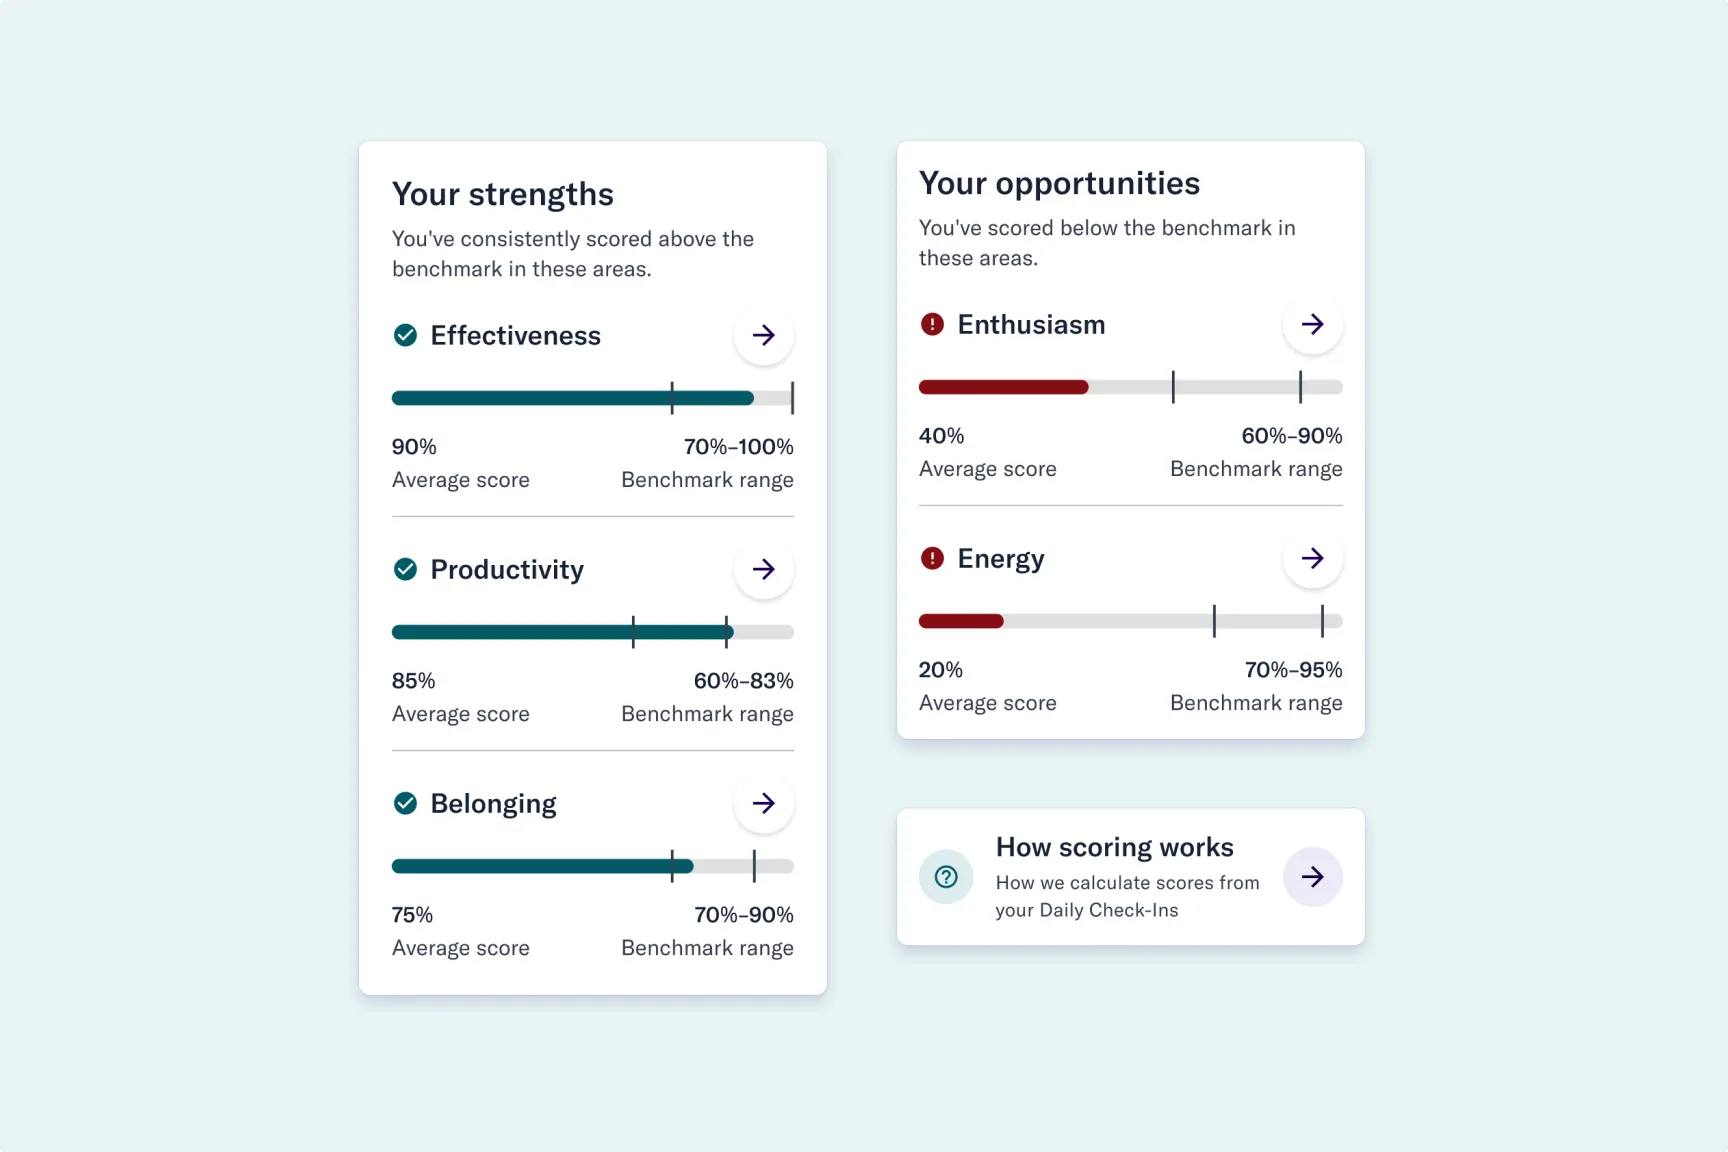
Strengths and opportunities
Understand where your strengths and opportunities lie and see how your responses compare to the benchmark range.
Methodology
We created a science-backed burnout assessment by combining elements of the Maslach Burnout Inventory (MBI) and the Utrecht Work Engagement Scale (UWES), fielding responses one day at a time to build the habit of checking in with yourself.
We use a benchmark range instead of an optimal range because it is more realistic, achievable, and sustainable. It is unlikely that anyone will consistently achieve 100% in any well-being area over time. By using a benchmark range, users can track progress and make gradual improvements.